 Code Details
Menu
Code Details
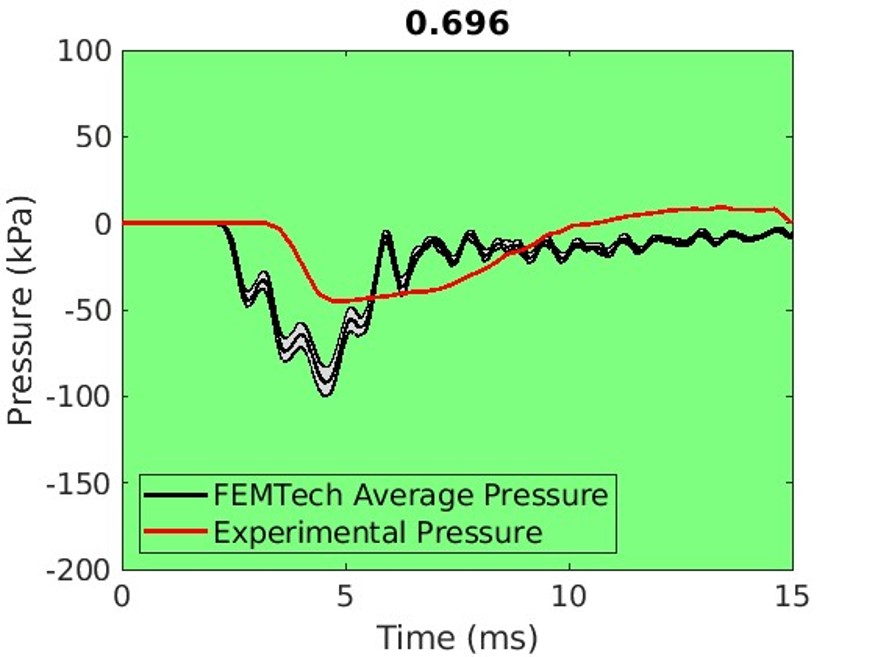
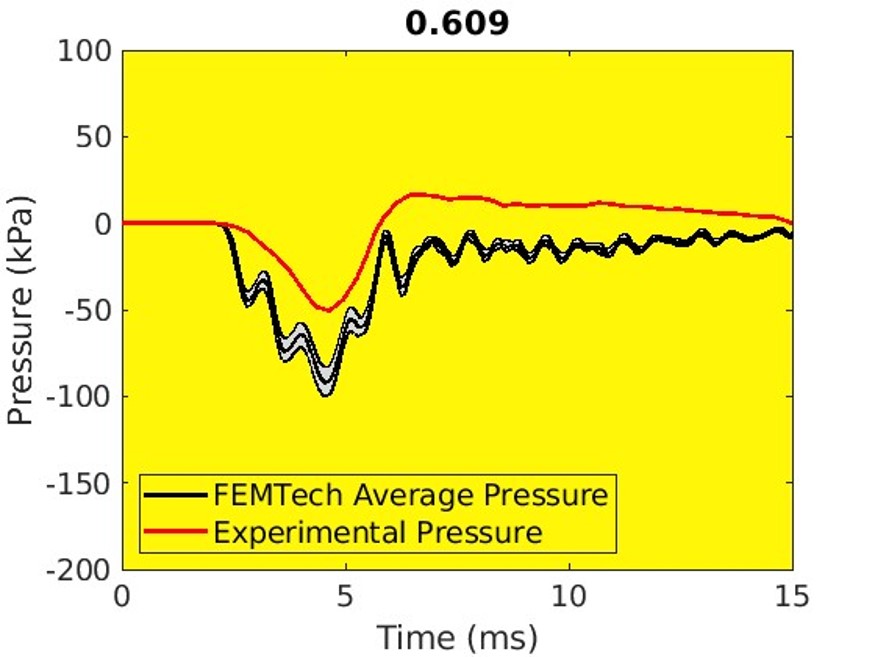
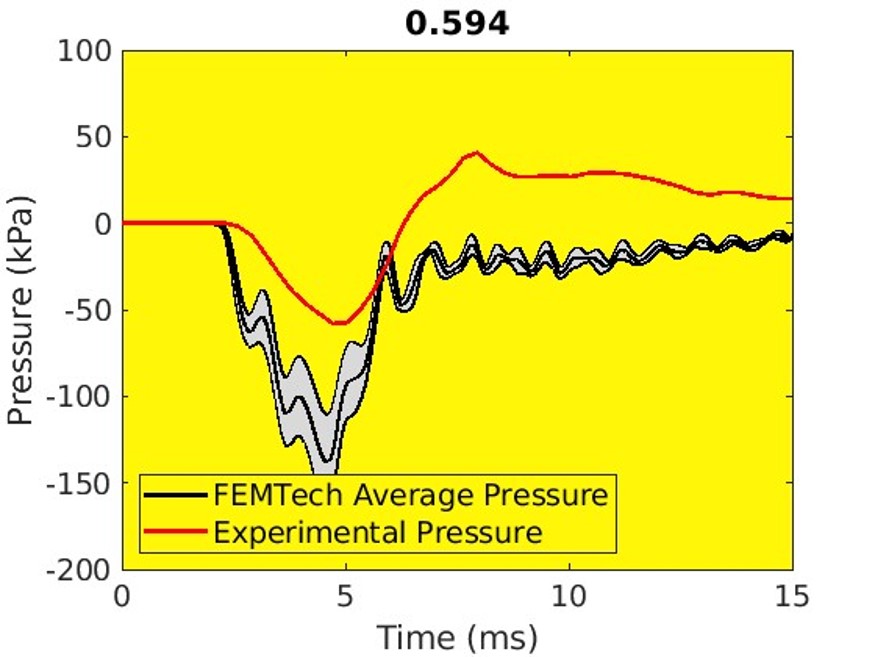
MenuPressure Response
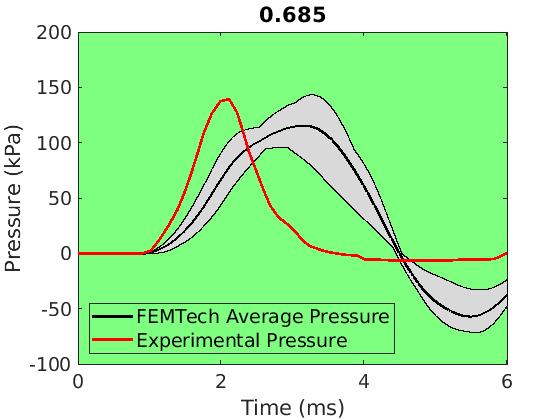
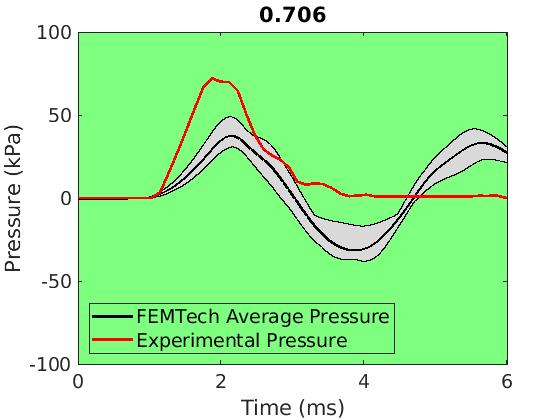
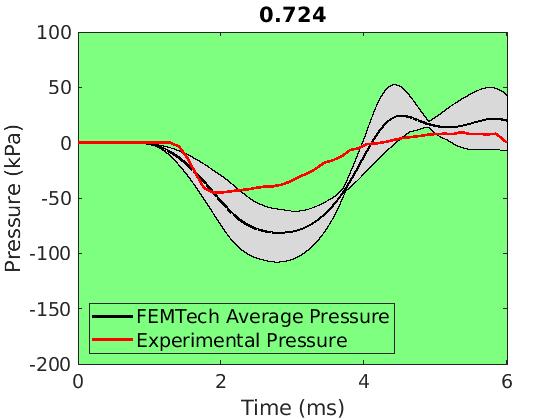
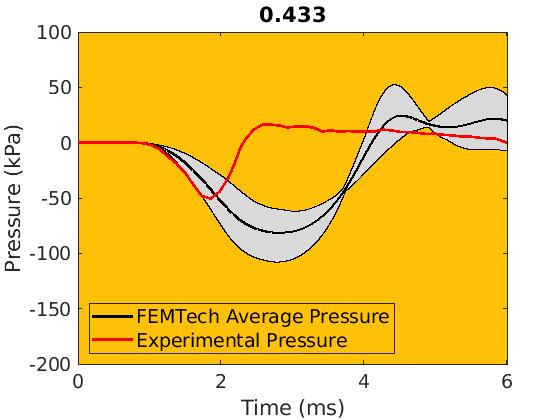
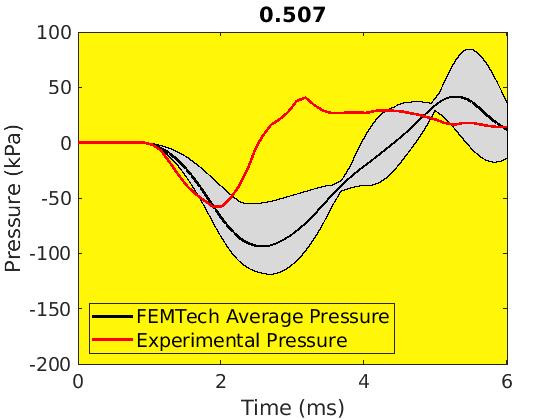
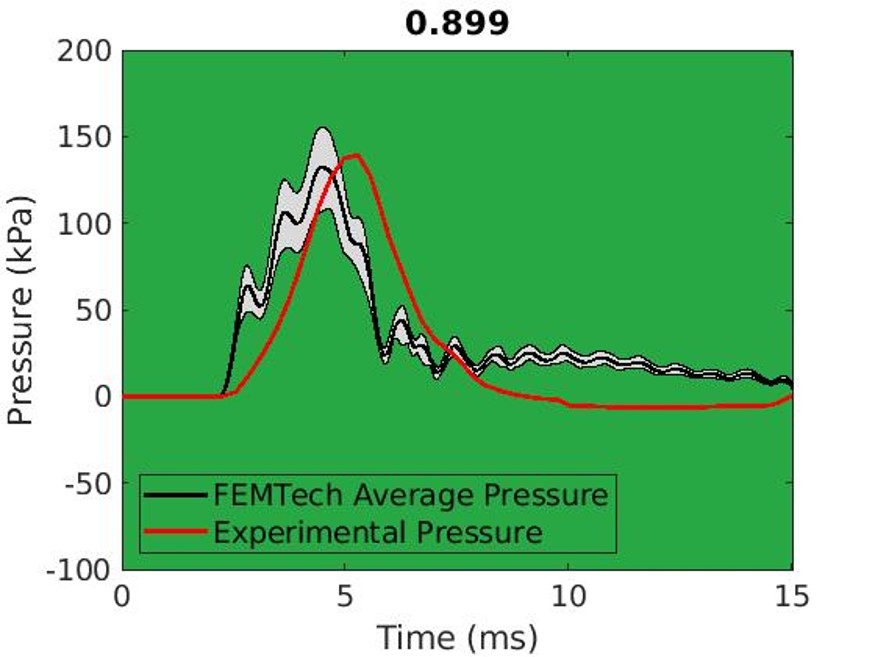
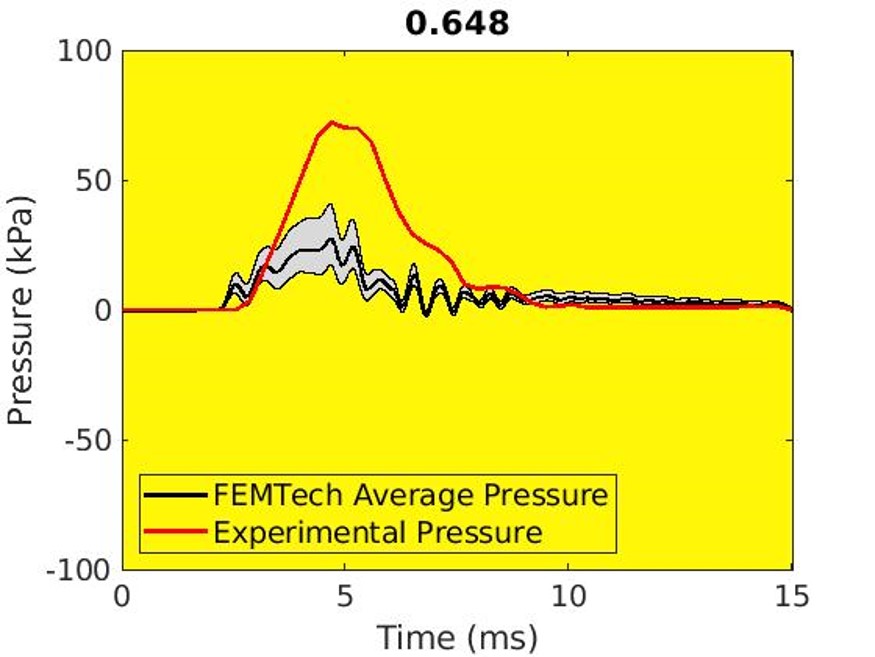
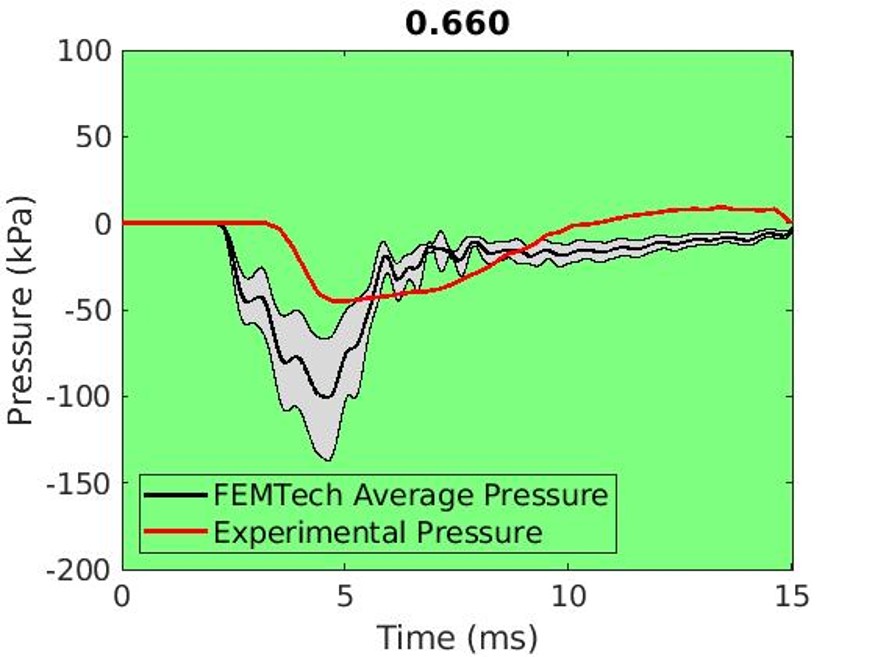
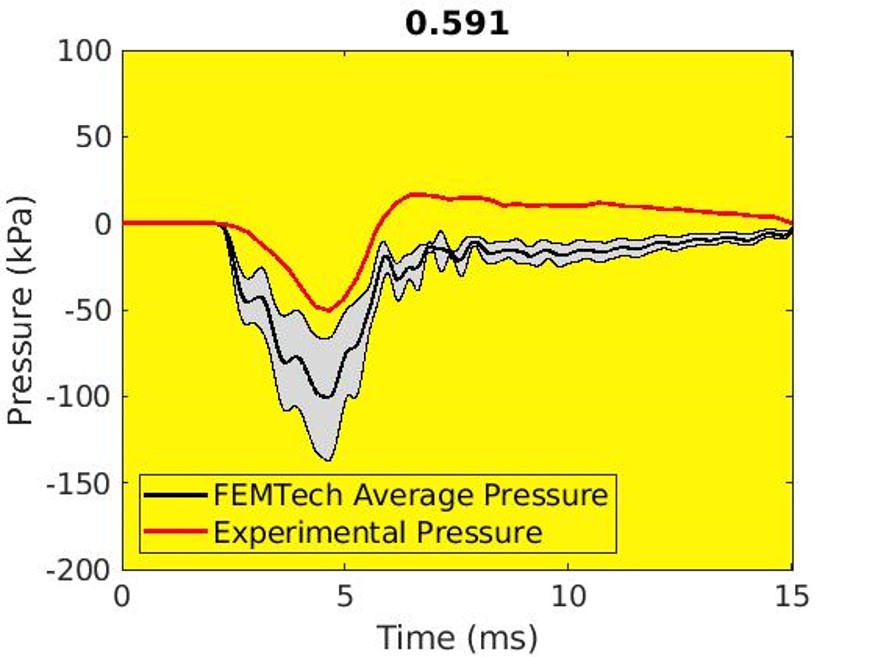
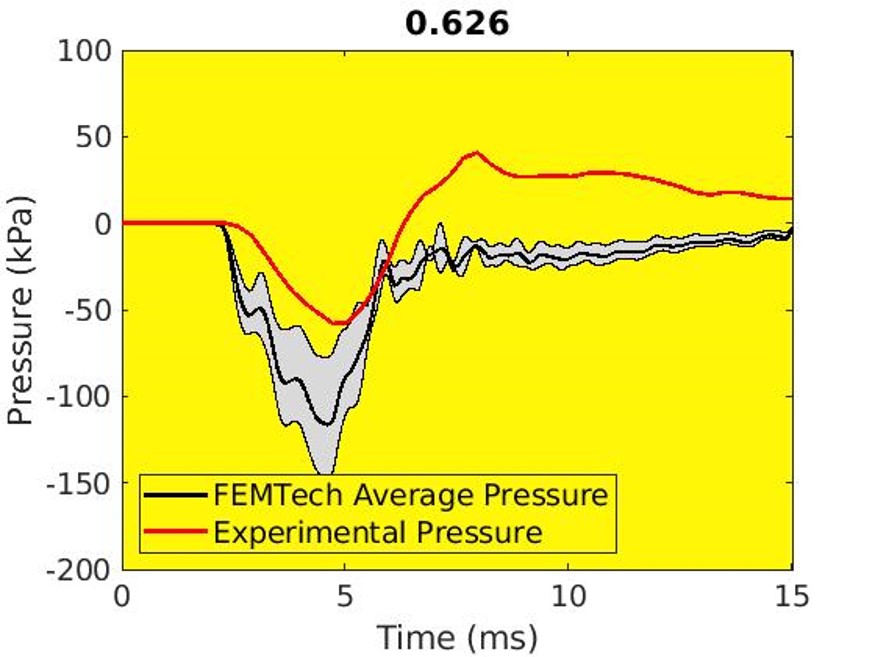
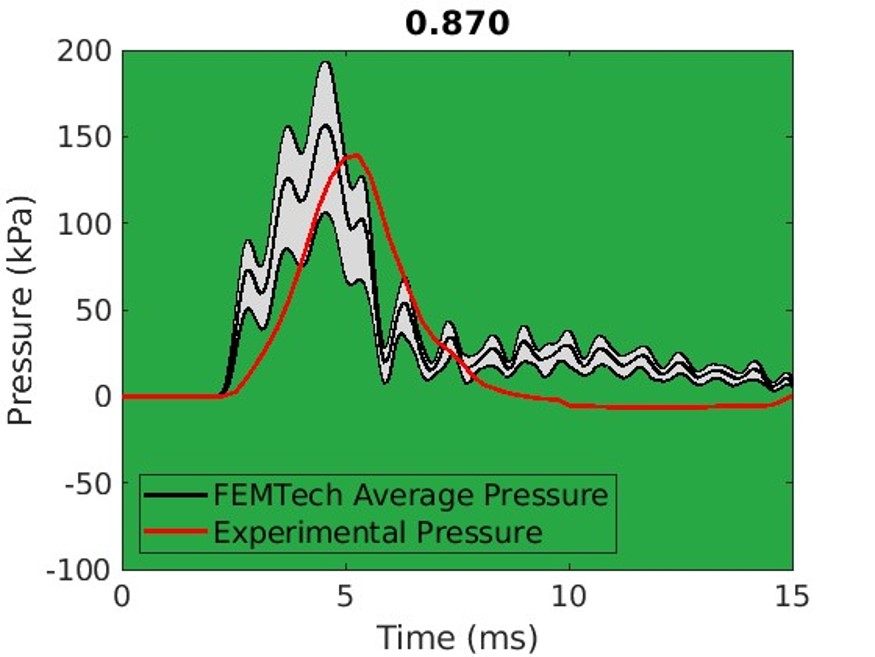
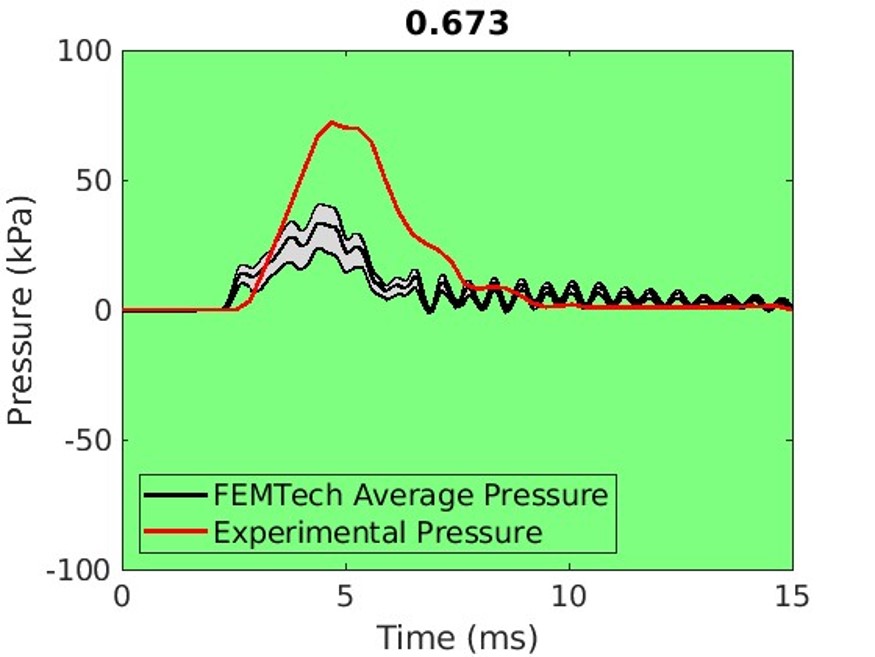
Intracranial pressure traces are compared with experimental results.
Mesh:
Code Version:
Pressure curves were created by averaging the pressure response over several elements in their respective regions. The gray shaded region shows the variation of the pressure response for different elements.
This validation data is from: Nahum, A. M. (1977). Intracranial pressure dynamics during head impact. In Proc. Stapp Car Crash Conf., 1977.
Frontal
Parietal
Occipital 1
Occipital 2
Posterior Fossa
Not Found
Frontal
Parietal
Occipital 1
Occipital 2
Posterior Fossa
Frontal
Parietal
Occipital 1
Occipital 2
Posterior Fossa
Not Found
Not Found